Scientific Responsible : Christina Zarafonitou Professor of Criminology, Director of the Laboratory of Laboratory of Urban Criminology of Panteion University
Working Group: Associate professor A. Mimis, Dr. D. Kalamaras, Th. Synolakis (PhD candidate)
Introduction
In the context of the BeSecure–FeelSecure (BSFS) project, which aims to strengthen citizens’ level of security through crime prevention interventions (spatial, social etc.), the implementation is preceded by a diagnostic survey, which aims, among other things, to measure the baseline values of the result indicators. These baseline values are evaluated in a second phase after the implementation of the interventions foreseen by the program.
The objective of the present diagnostic research is to achieve a detailed picture of the dimensions of criminality and insecurity as well as the factors related to it, in the 2nd and 5th municipal departments of the city of Piraeus. In this context, two diagnostic researches were implemented in the abovementioned municipal departments. The first research, which concerns the general population, was carried out through telephone interviews with a representative sample of households in the area of interest. The second research was carried out among professionals of that area, in their workplace, using the method of personal interviews (Face to Face). The purpose of the survey in the general population was to measure, among others, the baseline values of specific result indicators that refer to: a) perception of safety, b) fear of crime, c) individual participation in community-based crime policy, d) intention to participate in community-based crime policy and e) citizens’ trust to local authorities regarding urban security issues.
Throughout the 2nd phase of the implementation of the BSFS program both the survey of the general population and the shopkeeper survey will be repeated in order to evaluate the impact of the project. Especially for the survey of the general population, the values of the aforementioned efficiency indicators will be re-evaluated.
In the following chapters, the key stages of the implementation and findings of this first diagnostic survey in the general population of the 2nd and 5th Municipal Districts of Piraeus will be presented.
Purpose of this research
Scope
The purpose of the survey is threefold. Firstly, the quantitative and qualitative dimensions of crime as well as the dimensions of insecurity and the related factors will be statistically analyzed. Secondly, the exploration of the spatial variability of crime and insecurity will be examined through map visualization and finally, the result indicators will be described and evaluated in order to serve as a baseline for comparison.
Research type/Sampling
The research was quantitative, and it was conducted via telephone interviews with the use of a structured questionnaire during the time period of 22 to 24 June 2020. A stratified sampling technique (strata – MD2 and MD5 residents) at a household level was used for the sampling in the two municipal departments (MD2 & MD5). Τhe interview process resulted in 539 filled questionnaires, 265 from residents of MD2 and 274 from residents of MD5
Regarding the sample characteristics, it was composed mostly of females, aged 55-64 and over. Most of the sample were permanent residents of the area, married or had a cohabitation agreement, while in the majority of the cases in the households there were between 0 to 2 children. In terms of occupations, retirees and private sector employees were mostly reported. The educational level of the respondents was high or relatively high, as the majority of them were high school graduates, or bachelor’s degree holders. In terms of their financial status, the overall picture reflected a moderate to good financial status.
Results
Perceived crime level and insecurity
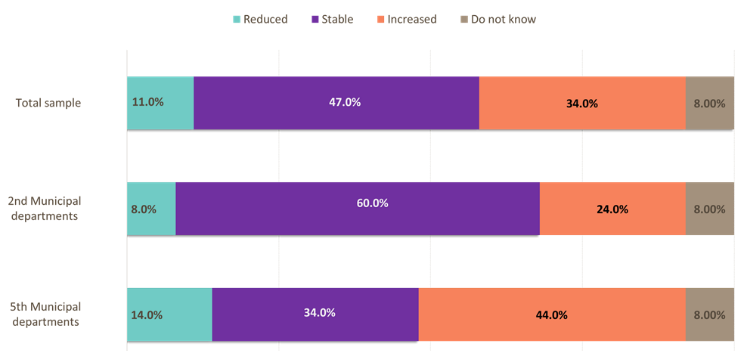
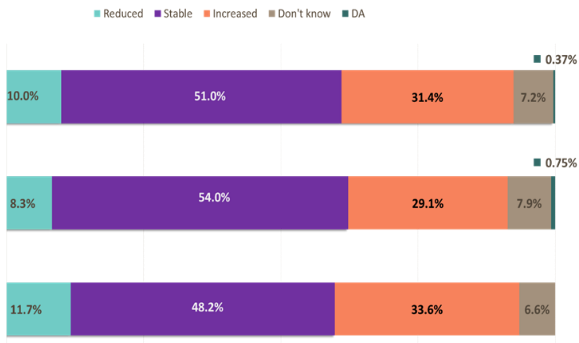
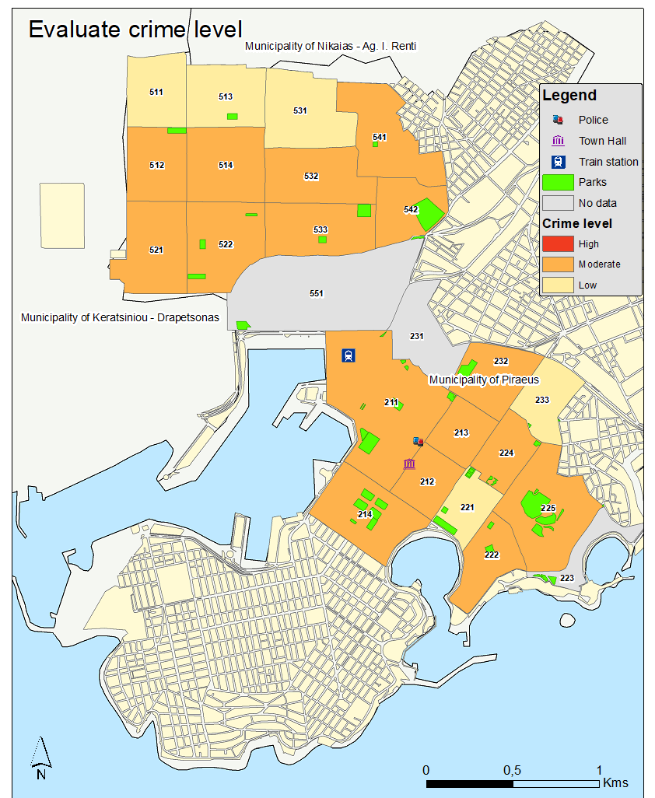
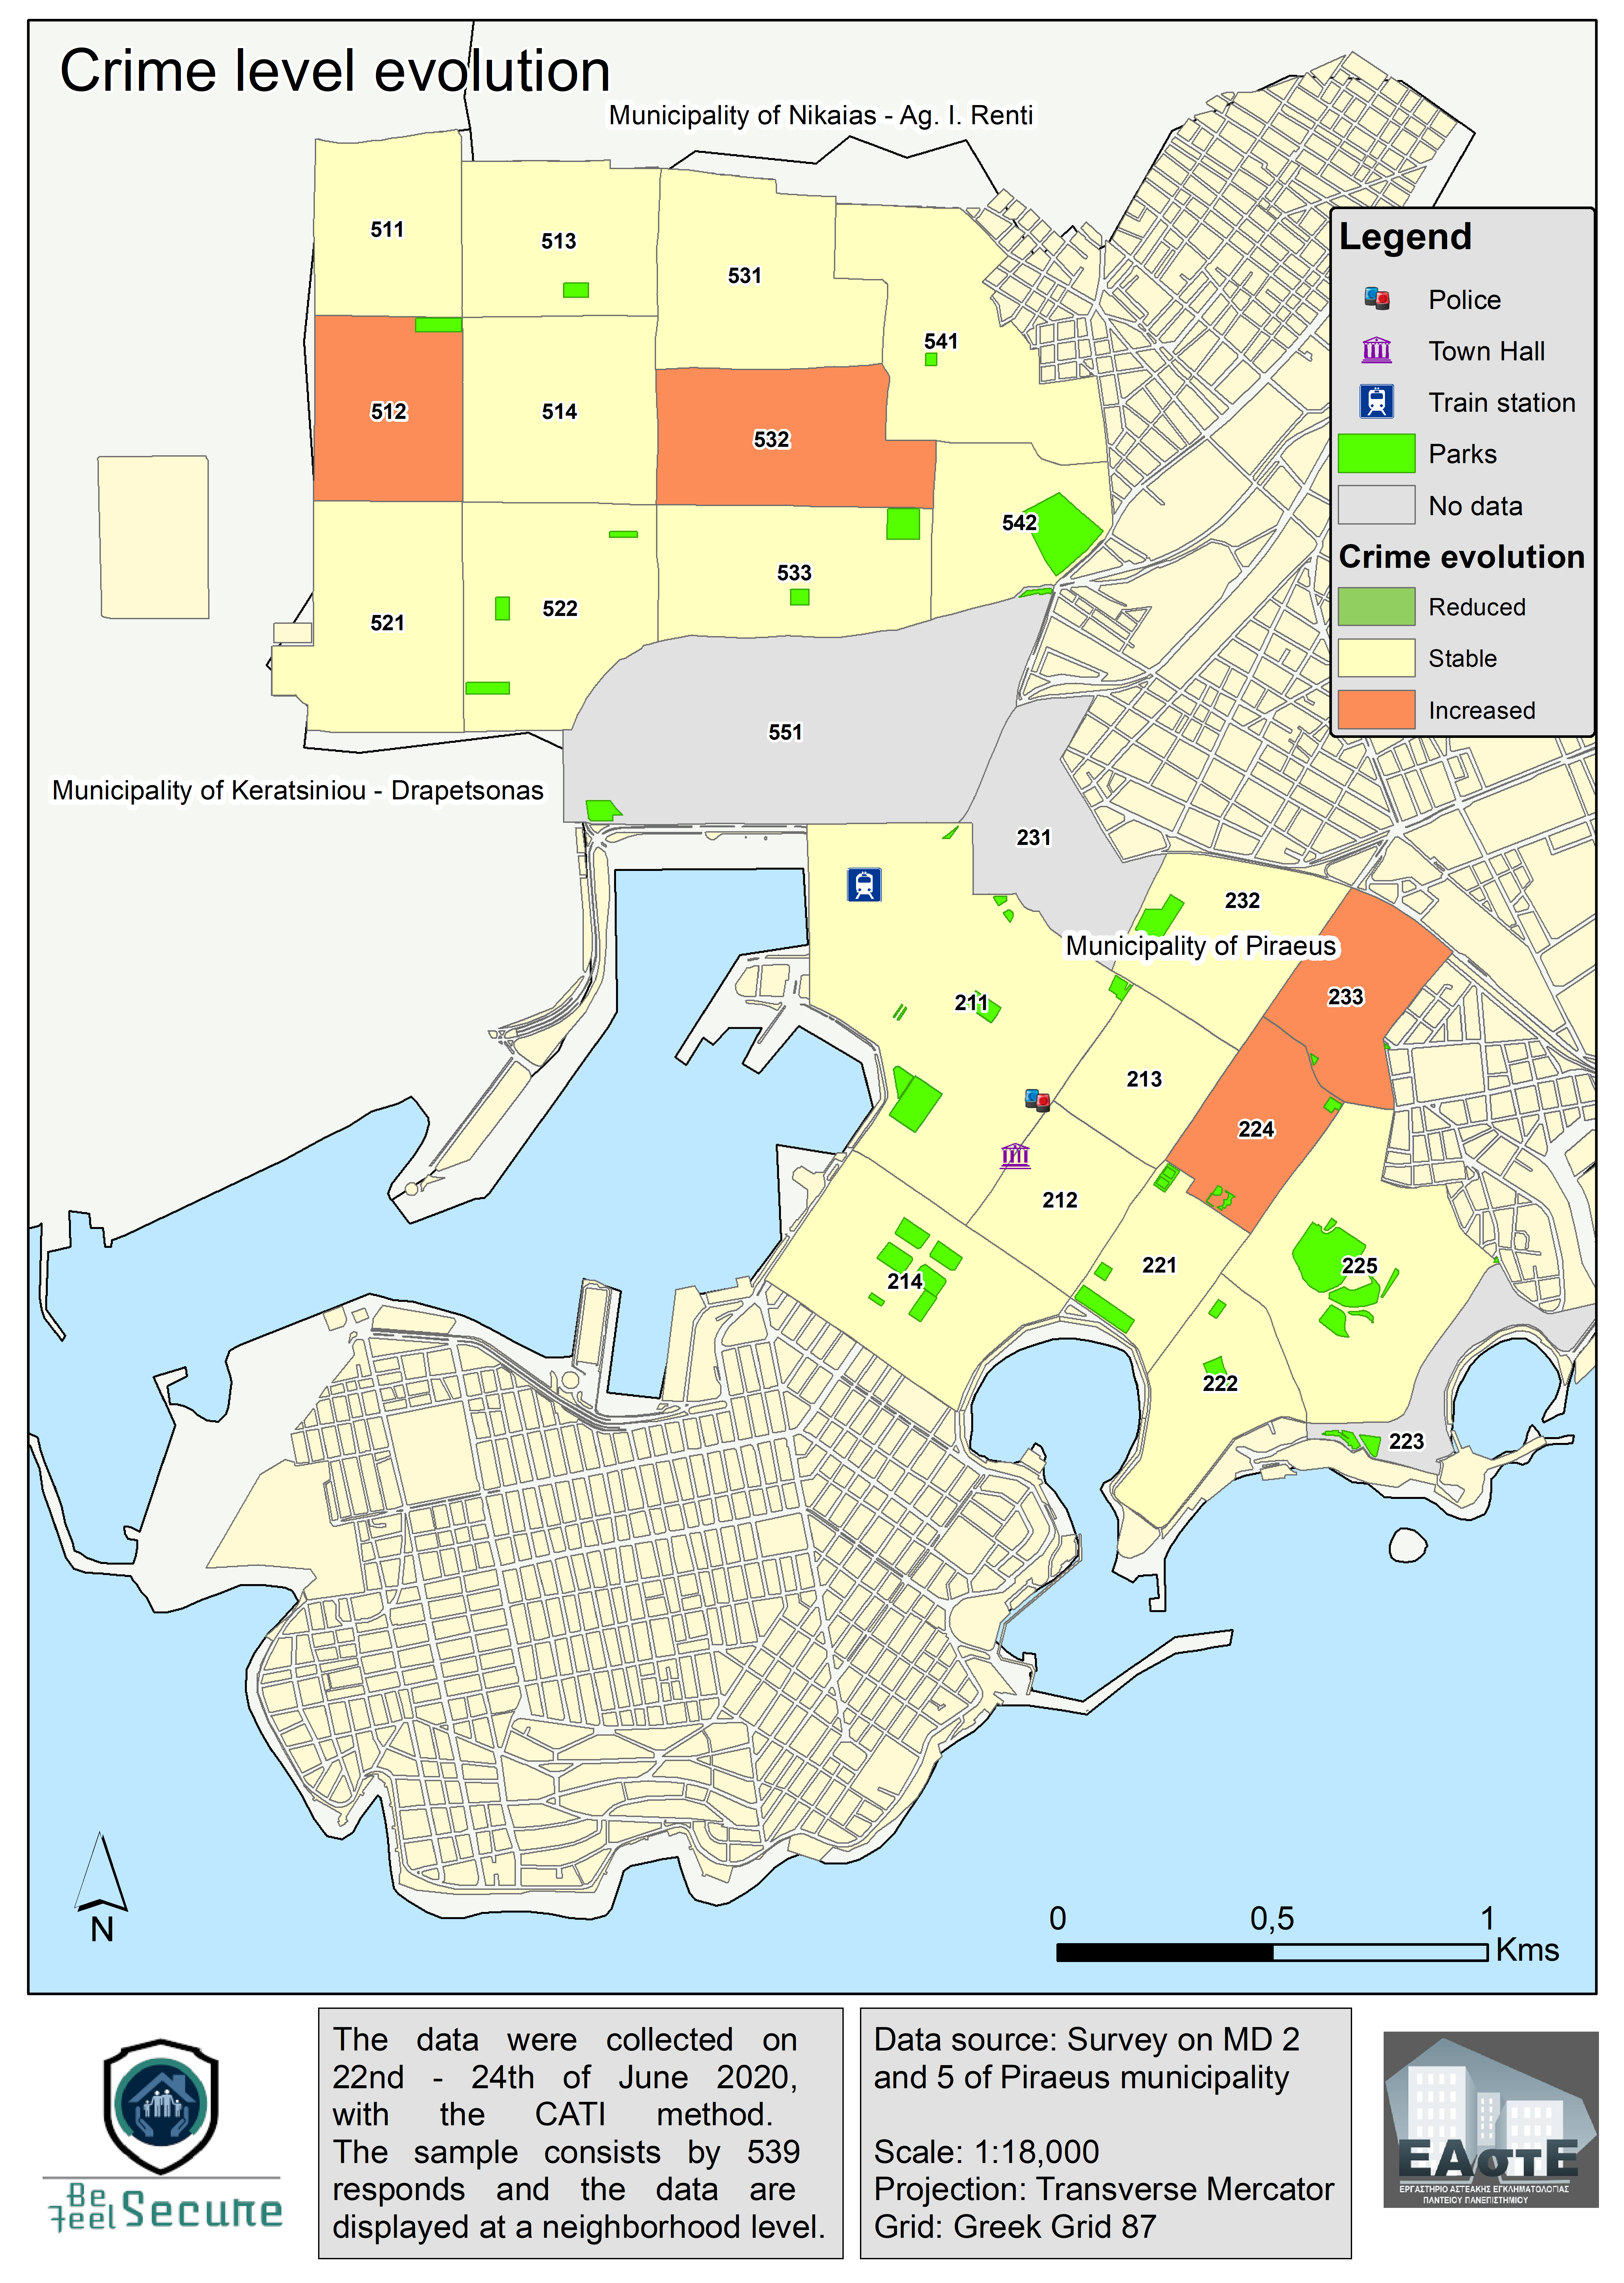
The majority of the population believed that the crime level in the area of residence was moderate (see Graph 1). Similarly, at the neighborhood level, the prevailing belief was that the crime level was moderate with a few exceptions at the north of MD5 and the regions #221, #233 at MD2 (see Map 1 below). According to the answers given for the crime rates evolution, the impression of a stable crime rate is clear, as there is a slight difference between the responses given in the two municipal departments (Graph 2). Map 2 displays the crime level evolution at the neighborhood level during the last three years, where the most common belief was that the crime level is stable. Exemption to that exists, in both MD2 and MD5, and specifically in neighborhoods #512, #532 and #224, #233 where the crime level is believed to have been increased.
In order to diagnose more thoroughly the origin of the residents’ perception crime level, their previous experience of victimization was examined through the question “In the past year, have you or a family member been a victim of one or more criminal offenses?”.
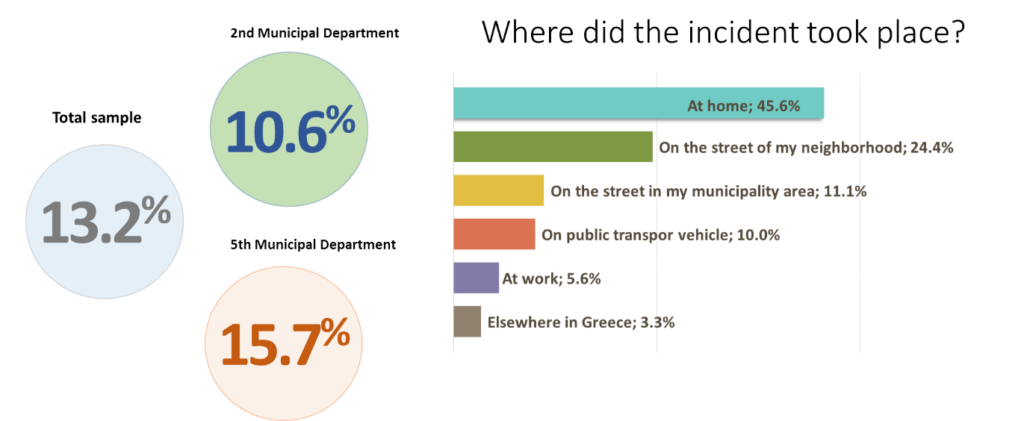
The answers show a low victimization rate (13.2%), lower than the generally applicable rates, while the residents of the MD5 reported a higher percentage than the ones in MD2. The majority of incidents occurred at home, in the neighborhood or within the boundaries of the Municipality of residence. The criminal offenses of which the respondents were victimized were mostly thefts/burglaries (59.5%) and robberies (14.3%).
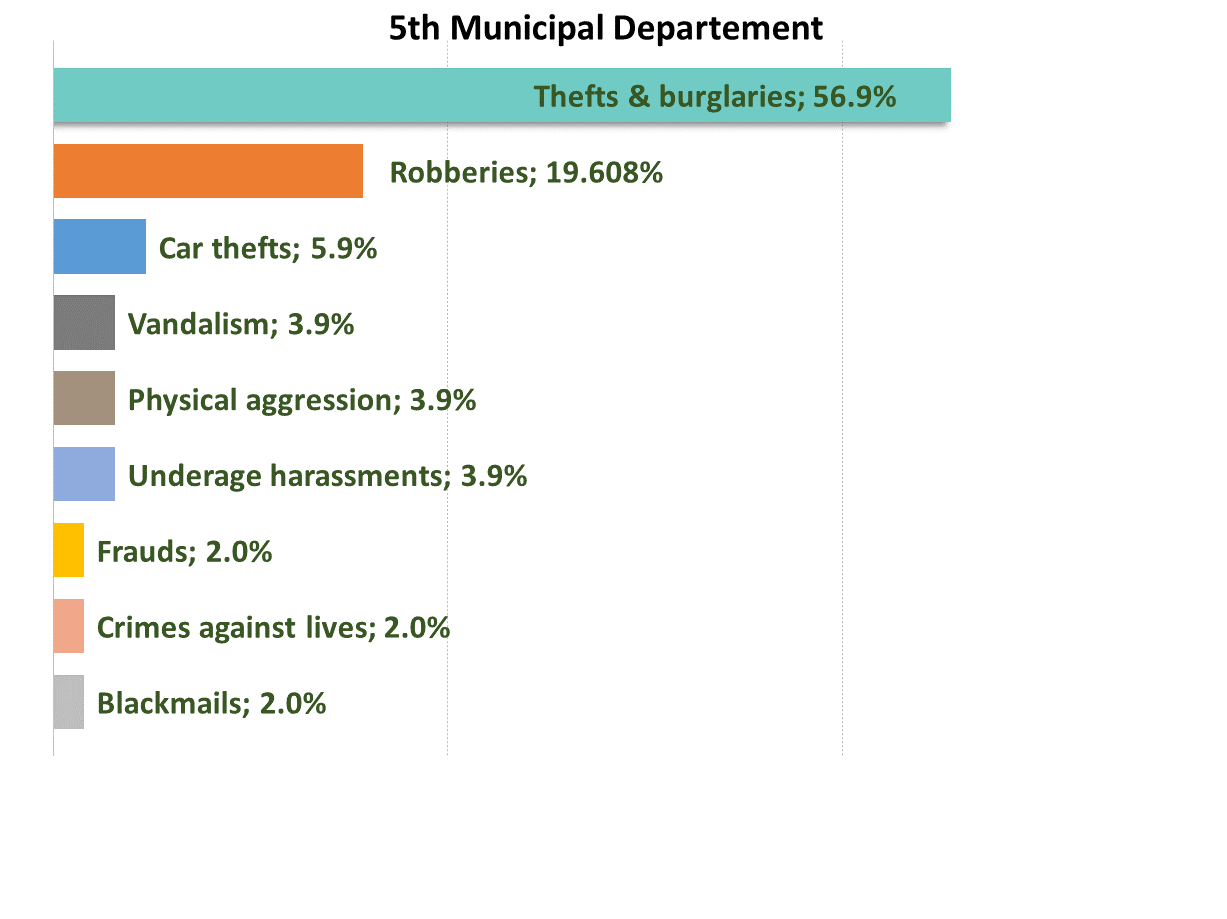
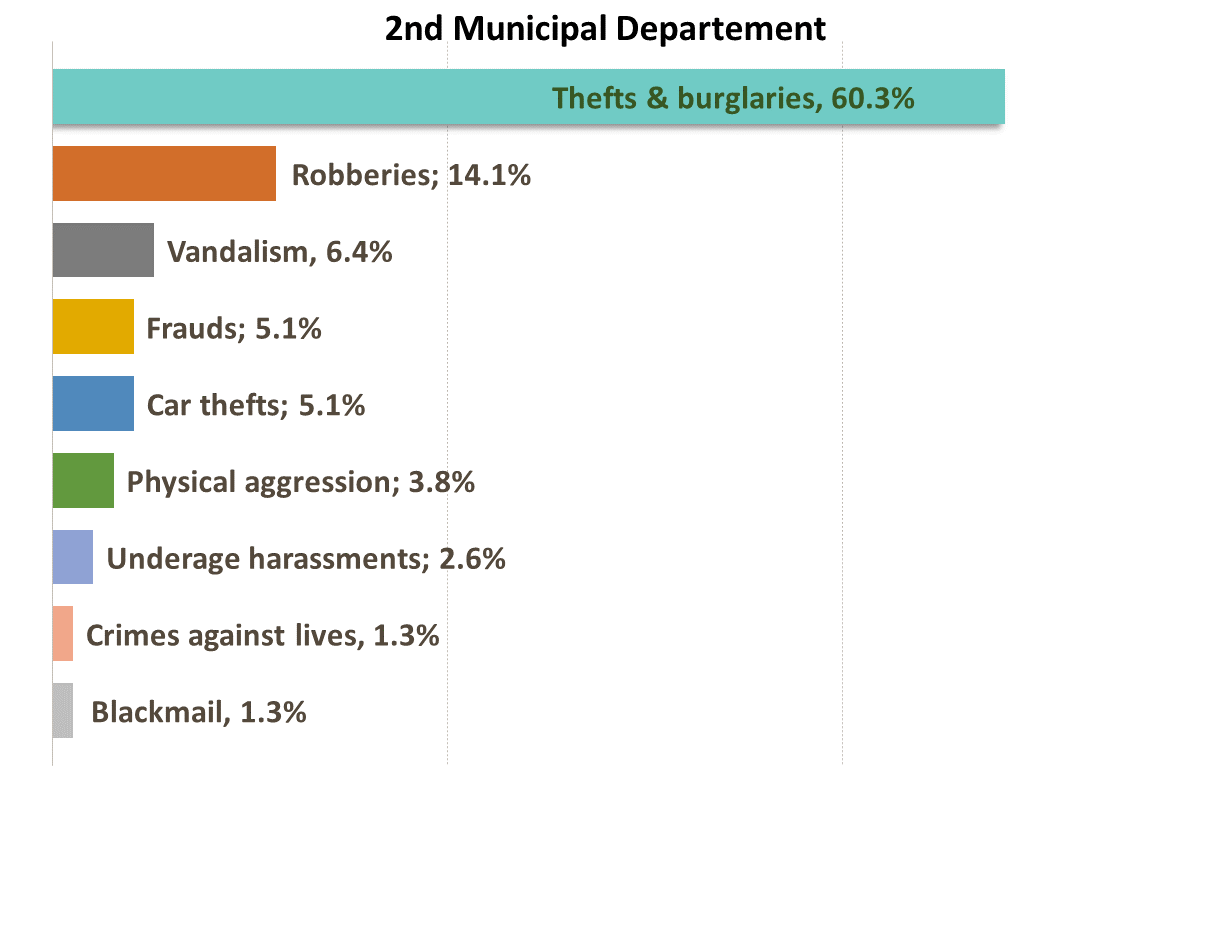
Graph 4: Offenses of which the respondents were victimized, per Municipal Department
According to statistical significance results (based on Chi Square test), the victims are mostly:
- residents of the 5th Municipal Department
- women
- of poor financial status
Insecurity and fear of crime
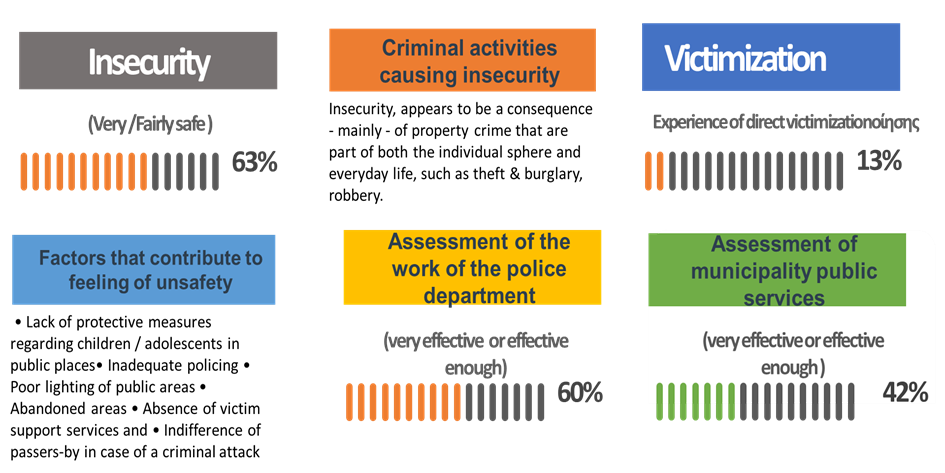
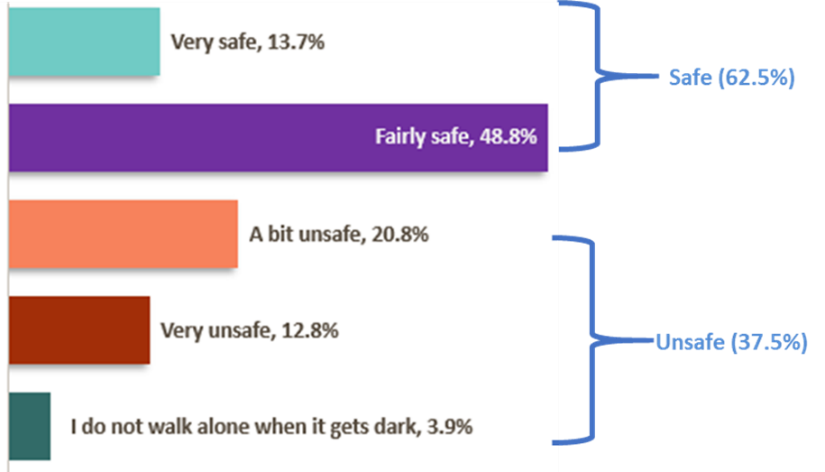
Levels of insecurity were measured based on the answers to the question “How safe do you feel walking alone in your area after dark?”, which is the question used internationally for recording the dimensions of fear of crime. The answers are illustrated in Graph 5 below, where the derived conclusion is that the majority of the sample (62.5%) feel Very or Fairly safe.
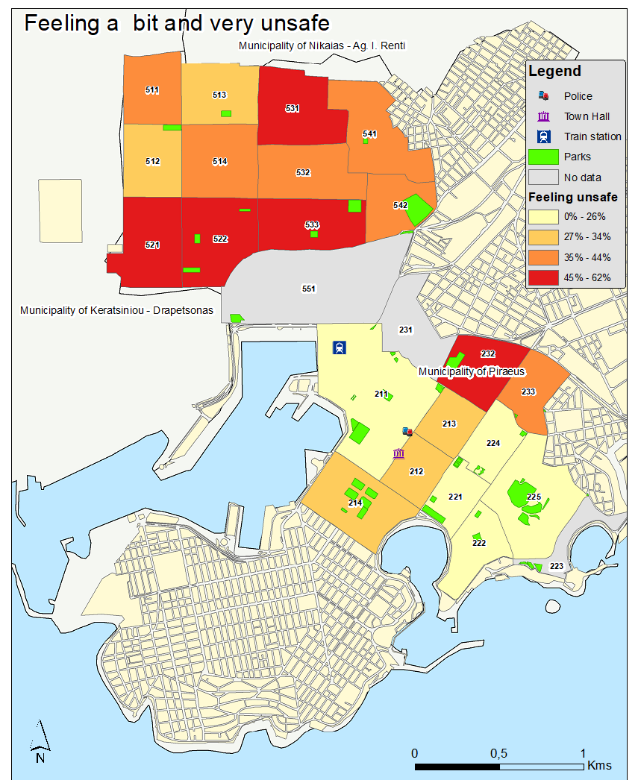
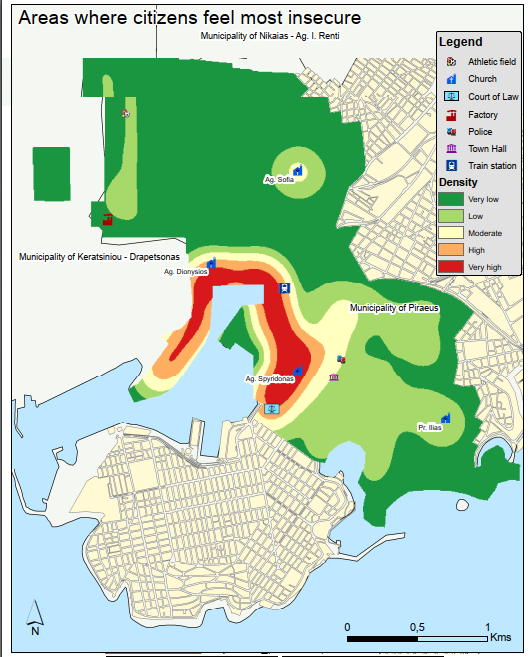
The analysis at the neighborhood level shows the distribution of the respondents that feel a bit or very unsafe in the two Municipal Departments. According to the research data the respondents of the 5th MD feel more unsafe compared to the respondents of the 2nd MD (see Map 3). Specifically, in all neighbourhoods a 27% or more feel a bit unsafe or unsafe to walk alone after dark. On the contrary, half of the neighbourhoods in MD2 have a percentage lower to 27%. In addition, regardless of the area of residence of the respondents, the greatest insecurity is observed in a wider area around the Port and not only near the train station, in an area that extends approximately from Gate 2 of the Port to the Courthouse of Piraeus (Map 4).
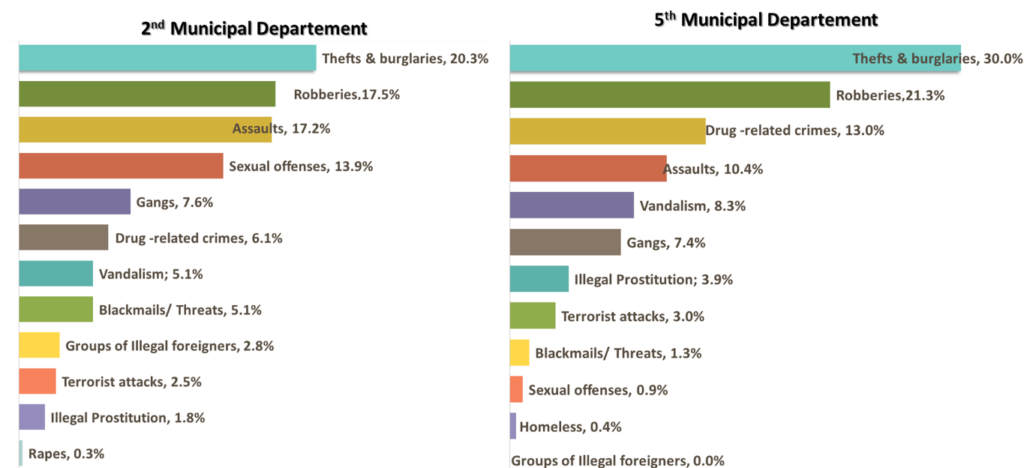
Respondents who answered that they felt a bit or very unsafe were asked to indicate which criminal behaviors were causing them insecurity (Graph 6). Based on the responses, insecurity, appears to be a consequence – mainly – of theft / burglary robbery, life assault, sexual offenses and drug related crimes. In addition, some offenses, such as assaults and sexual offenses were overrepresented in the 2nd Municipal Department, while thefts & burglaries, robberies and drug related crimes were overrepresented in the 5th Municipal Department.
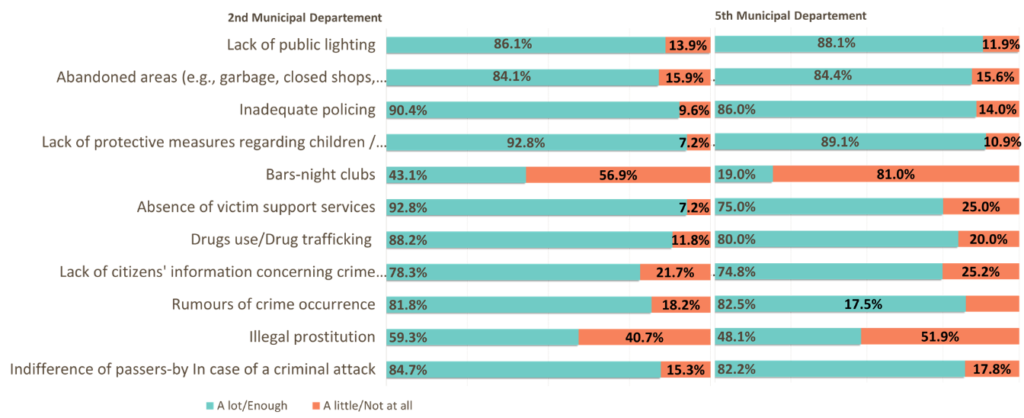
The main factors contributing to insecurity (Graph 7) have to do mainly with elements of environmental and social degradation and inadequate policing, but also with the absence of specific municipal services (absence of victim support services), lack of protective measures for children in the public space, or the lack of social cohesion, (indifference of passers-by in case of crime attack).
According to statistical significance results (based on Chi Square test), the characteristics of the most insecure can be summarized as follows:
- those who had previously reported victimization
- residents of the 5th Municipal Department
- women
- older residents
- divorced
- housewives, retirees and traders
- lower educational level
- poor financial situation
Citizens’ attitudes towards formal social control of crime
The citizens’ perception regarding the role of police in dealing with crime was also investigated. This role becomes even more important in the urban context, because of the weakening or absence of informal social control and the loosening of social bonds
Assessment of the work of the police department of the residential area
The responses regarding the assessment of the work of the police department in dealing with crime, are listed in Map 5 and Graph 8 below:
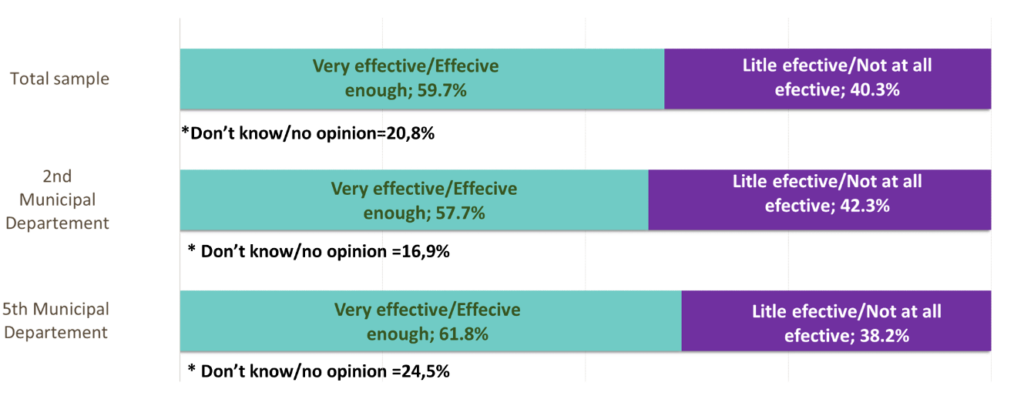
In general, a positive assessment was recorded regarding the work of the Police (Graph 8), since almost 6 out of 10 respondents (59.7%) assessed the work of the Police Department as effective enough, with residents of the 5th Municipal District showing higher satisfaction rates in comparison to the residents of the 2nd Municipal Apartment (Graph 8 and Map 5).
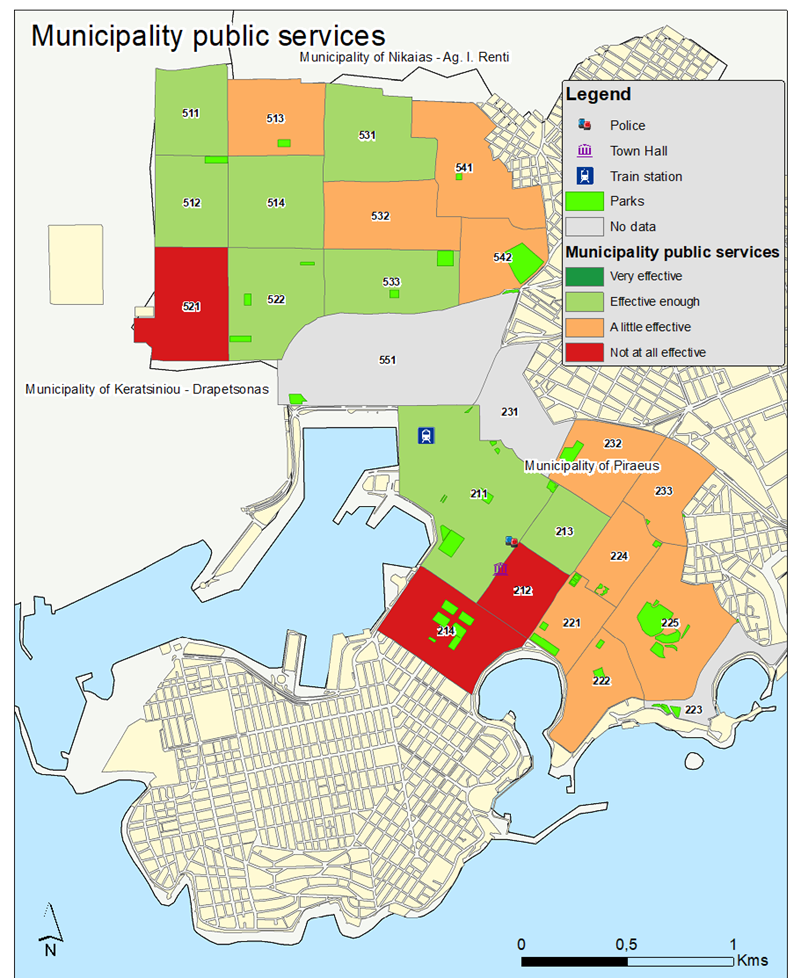
Assessment of municipality public services
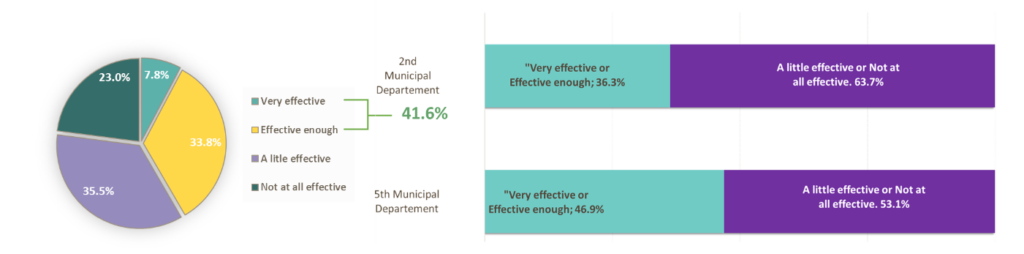
Given that the role of the local authorities is of great importance for the improvement of the citizens’ everyday life, this section is dedicated to their attitudes towards the services offered by the Municipality. According to the research data 4 out of 10 respondents (41.6%) answered that the Municipality’s services, dealing with everyday problems of the citizens, are effective enough (33.8%) and very effective (7.8%), while per municipal department, residents of the 5th MD, appear in higher percentages satisfied with the efficiency of the Municipality’s services.
Result indicators
Indicator 1: Perception of Safety Indicator
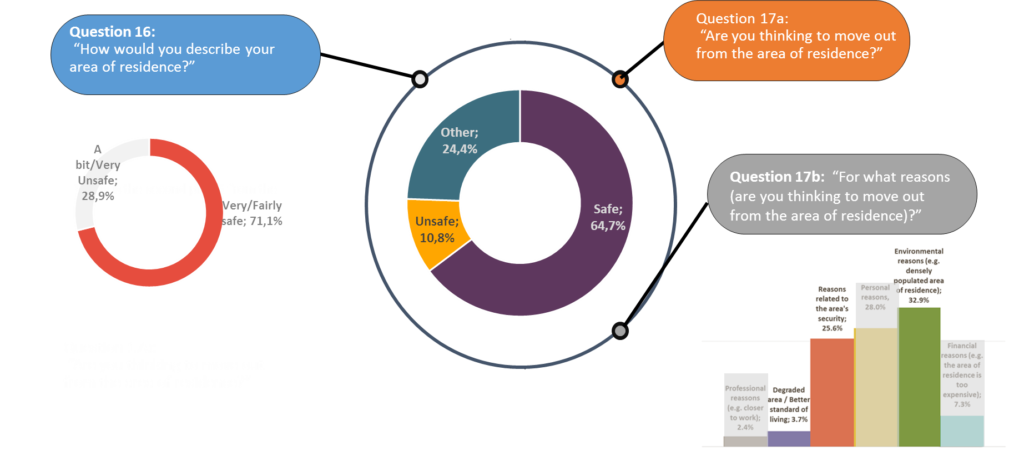
This indicator assesses the respondents’ satisfaction form the social and physical elements of the area of residence. Responses to three survey questions were combined to calculate residents’ perception about the safety of their area (see graph below).Based on the above typology, the baseline value of the specific indicator, regarding the reference category (Safety), was calculated equal to 64.7% and describes residents who consider that: “Their area of residence is very or fairly safe and they have no intention of moving or if they do move it is not for reasons related to the safety of the area”.
Indicator 2: Insecurity/ Fear of Crime Indicator
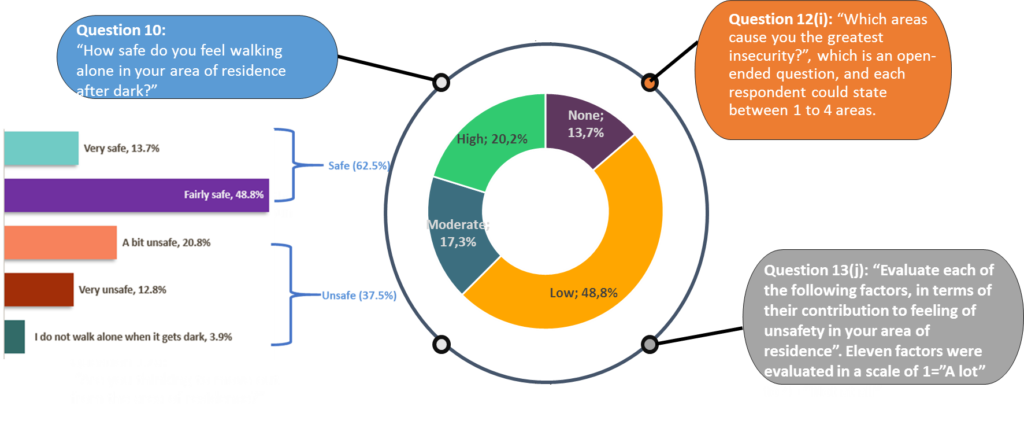
Fear of crime indicator is captured by (a) the level of insecurity in the neighborhood of permanent residence of the respondents, (b) the number of occurrence of the type of the most insecure areas and (c) the factors that contribute to the creation of the feeling of insecurity. To do that, three survey questions (see graph below) were used in order to estimate an aggregated percentage score comprising level of insecurity and the areas where it is caused, as well as the factors related. The baseline value of the specific index, regarding the reference category (High fear of crime), was calculated equal to 20.2%.
Indicator 3: Citizens’ participation in crime prevention programs Indicator
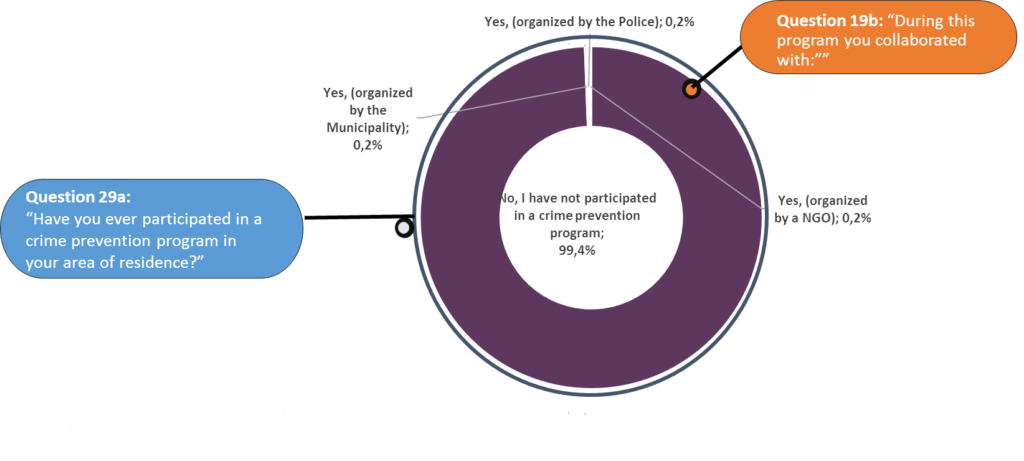
This specific indicator measures the number of citizens participating, planning and implementing crime prevention measures undertaken by the community. Based on the calculated base value for this indicator (99.4%), only 0.6% of respondents stated that they have participated in a crime prevention program in their area of residence.
Indicator 4: Intention to participate in a crime prevention program Indicator
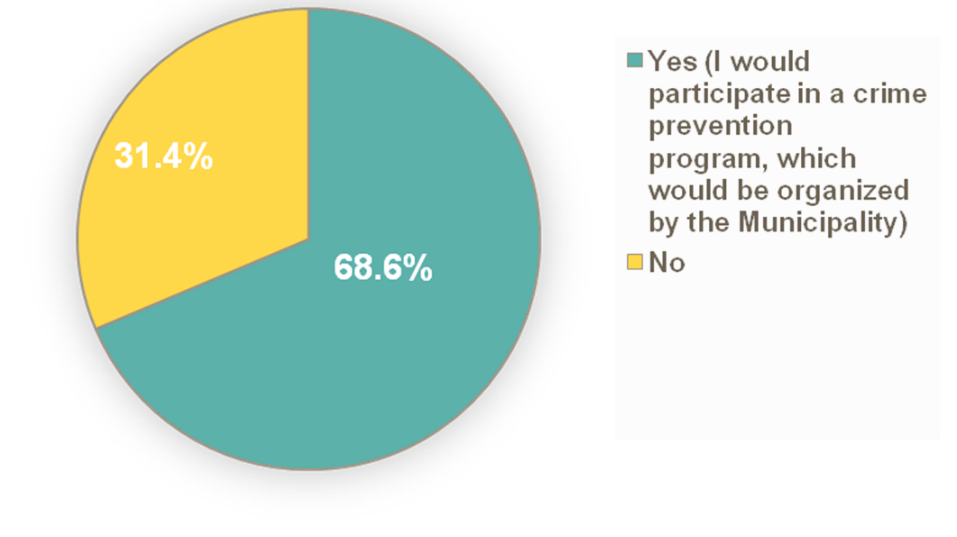
The baseline value of the specific one-dimensional indicator (68.6%) corresponds to residents who answered positively to the question “Would you participate in a crime prevention program in your area, in collaboration with the Local Council for crime Prevention?”.
Indicator 5: Citizens’ trust to local authorities Indicator
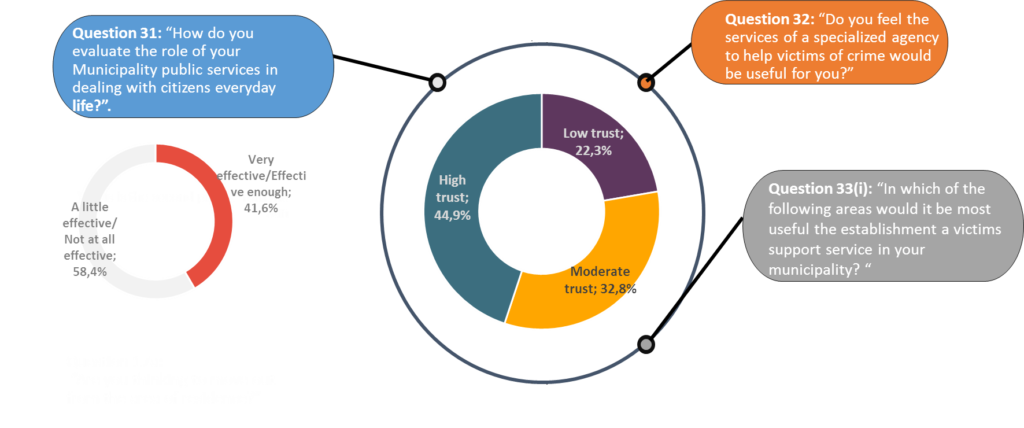
The fifth indicator captures the citizen’s trust to local authorities regarding urban security matters. Three survey questions were used in order to estimate an aggregated percentage score comprising level of trust to the local authorities. The results of the fifth indicator, regarding the reference category (High trust) was calculated equal to 44.9% (see graph below)
Dissemination of the findings (conference)
“Participatory Forms of Crime Prevention at the Local Level Security and Freedom” workshop
In the context of a workshop entitled “Participatory Forms of Crime Prevention at the Local Level Security and Freedom” organized by the Laboratory of Urban Criminology of Panteion University on 22/6/22, at the premises of the Piraeus Chamber of Commerce and Industry, part of the findings regarding the diagnostic research implemented for the residents of the 2nd and 5th Municipal Apartments (MD) of the Municipality of Piraeus was presented.

The presentation of the research findings focused on the dimensions of crime and the feeling of safety and the related factors, on the spatial variability of crime and insecurity and the description of the indicators measuring the effectiveness of the BSFS project interventions in the community.
In brief, the sample reported a stable percentage of crime in their area of residence and low victimization rates, (especially by residents of the 2nd MD) while the most frequently reported crimes of which they have been victimized were thefts/burglaries and robberies. Furthermore, high percentages of feeling of safety were recorded, especially among the residents of the 2nd MD. The main factors that contribute to the residents’ feeling of insecurity were the lack of protective measures regarding children in public spaces, inadequate policing, elements of environmental and social degradation (e.g. lack of lighting, abandoned areas, drug use) but also the lack of initiatives that could be undertaken by the Municipality (e.g. victim support service) as well as the indifference of passers by in case of a criminal attack. In general, a high percentage of positive evaluation of the work of the Police, in terms of dealing with crime, and a moderate percentage of positive evaluation of the services of the Municipality, in terms of dealing with the problems of citizens’ daily life, were recorded.
“Urban Security and Victim Support” webinar
In addition, in the context of a webinar entitled “Urban Security and Victim Support” the findings of the second diagnostic survey, which was implemented during the first phase of the BeSecure-FeelSecure (BSFS) program, were presented. The webinar that took place on 17 January 2022 was organized, in the framework of the BSFS program, by the Laboratory of Urban Criminology of Panteion University in collaboration with the Municipality of Piraeus, the Ministry of Citizen Protection and the Piraeus Chamber of Commerce. The above-mentioned research was carried out with personal interviews in the workplace of 100 professionals of the 2nd and 5th Municipal Districts of the Municipality of Piraeus, during the period from July 6 to 10, 2020. This discrete diagnostic research, on store owners and employees, was deemed necessary in order to achieve a complete and detailed picture of crime and the shop owners’ insecurity and the related factors. These specific departments of the Municipality of Piraeus, i.e. the 2nd and 5th MD, include areas with a limited number of households and are mainly made up of shops.
The presentation of the survey findings focused on the insecurity of the shop owners, where half of the shopkeepers responded that they feel quite or a little safe. Shop owners in the 5th Municipal Department reported higher rates of insecurity, as well as a clear impression of an increase crime level. The most important threats are similar to those in the general population survey and are related with property crimes (theft & burglary). Regarding the reported victimization rates, they are higher than the generally applicable 44% (46% for the 2nd and 42% for the 5th MD). The crimes to which the participants are victimized are almost exclusively thefts/burglary and robberies and few incidents of violence against persons or things are revealed. Notable rates of repeated victimization were also recorded. The majority of the victims reported the incident to the police (70% in the 2nd and 62% in the 5th), a fact that shows their perception that crime is a matter that concerns the police, while the majority of them were not satisfied with how the incident was dealt by the Police, mainly due to the inability of the Police to find the offender or to recover the property goods. Finally, regarding the evaluation of the Municipality’s services (Municipal Police & Social Services), a concentration of responses towards the most negative evaluation (values 1 & 2 of the 5-point scale) was observed, specifically in the responses “Α little effective” and “Νot at all effective”.
Conclusions at a glance